Routine and repetitive surveys require a sophisticated and structured approach to the execution
of the survey and the management and reporting of the survey response data.
Designed well, robust and repeatable automated processes can take the grind out of handling survey datasets -
improving quality and reducing cost on a daily basis.
Survey Management System (SMS) is a web-enabled application which empowers the development, distributing and
analysis of survey forms to improve communication, process management, and decision support across
the organization. SMS is suitable for institutes that require surveying and interviewing techniques to measure
evaluation amongst different participant's levels and categories.
SMS provides extensive features (described in the following section) to harness a rich survey management experience.
Such management features include (but not limited to):
- A rich survey designing architecture
- Powerful survey distribution and redistribution methods
- A rich role-based accessibility engine which encourages SMS users collaboration
- Lots of analytical reports
- Multilingual
SMS manages surveying projects from interception until termination. This section and underlying sections are dedicated to the basic architecture of SMS project, the project designing process, and finally the project reporting.
To create and administrate surveys, a well-defined list of system users, groups, and access rights should be developed. The main group in this list is the Project Management, which includes the users capable of data entry and survey design and distribution.
At the core of SMS lies the “Survey Entities” which drive the entirety of the system. Each survey entity in SMS is made up of a hierarchal structure of other types of survey entities and so forth. In specific, the following table shows the basic entities making up the SMS “survey Entities” architecture.
|
Type Name
|
Description
|
|
Survey
|
Is considered to be the top most organizational entity which is considered to be a representation of an execution context through which a survey is delivered
|
|
Section
|
A definite section included in a specific survey domain. A section shall be available through several survey domains
|
|
Question
|
A pre-defined question with a weight and a list of answers. A question shall be available through several sections as well as survey domains
|
|
Group
|
A pre-defined group of participants
|
SMS provides the means to set up survey forms which are made up of two levels. On the top level of a survey form are several sections where each section contains several questions underneath. The participant provides his/her responses to each question contained in a survey form.
The system includes wide yet extensible repositories of survey sections and questions. At this point there is no association between both repositories. however, it is the job of project designing to create the structure of survey forms using these two repositories from one side, and linking to a section and its sub-questions as part of the hierarchy.
SMS also provides the means to customize survey forms. Typically, a pool of survey sections and questions are set up first, then the project manager as part of the survey designing process choose a subset of that pool to assign to the certain survey form.
A carefully designed survey form is thus essential for evaluating the experience perceived by the participants throughout the survey lifetime. A survey is then equipped with the necessary analysis to provide the statistical insights needed to highlight opportunities where improvements can be achieved.
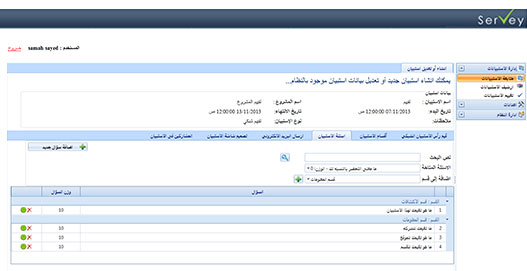
The following figure illustrates the vital Section Management module, where the system user (project manager) creates and manages question groups and categories (survey sections) that will later appear in the survey form.
The following figure illustrates the vital Question Management module, where the system user (project manager) creates and manages questions that will later appear under sections in the survey form
The two previous sections include the modules where the survey metadata is defined. The next sections include the modules where the survey is actually designed and displayed.
The following figure illustrates the linkage between Survey Sections and Questions through assigning questions to sections. This is considered the main step in designing the form survey architecture.
Another key feature that facilitates the survey design is the template “versioning” tool which allows the system user (project manager) to save a survey (including sections and questions) as a template and reuse this template while constructing another survey form to save time and efforts.
After the survey is designed, the project manager conducts an intermediate phase which he selects the list of target participants among which the survey will be distributed. Participants are allowed to access to the newly distributed survey once they log on to the system and will be able to submit their evaluations for as long as the lifetime of the survey.
Whenever a participant provides his/her scoring values for each question in the survey form, the system stores score as numerical data allowing for further statistical analysis ability. For example, the stored score data can be further analyzed outside the system using data analysis tools such as Microsoft Excel to find out any statistical indicators, for instance, the numerical tendency of a specific response over a period; which is a very effective measuring methodology to monitor improvements
A highly qualified survey form should classify participant's responses in separate categories; for instance, “favoring”, “disfavoring” and “neutral”. Given the benefit of numerical scoring, the system can classify each response as one of the abovementioned classes based on numerical ranges. The quantitative analysis achieved in this example is viable to analyze further the quality of each classification; that is to find out the strength of each classification separately. This kind of statistical analysis can lead to insights such as – for example but not limited to a certain fact – participants that are neutral to an issue “A” strongly pose their response than those who are favoring. In such argument, even though the majority of participants pose their responses as favoring, however, the quality of neutral responses is much more impacting the final decision. If the issue under analysis, for example, is the quality of a specific course, then such quantitative analysis can motivate an initiative to improve the course content although it is not apparent at first glance; this power is attributed in essence to the ability of the system to store numerical representations of trainees evaluation responses.
Figure (5) illustrates a sample survey form as displayed. It contains various user-selected sections each with a listing of questions and graded answers.
Whenever a new survey form is distributed and collected for evaluation, the system stores both the survey form (including sections and questions) plus the participant's evaluations to be further analyzed using either SMS reports or via MS Excel tools. This rich archival gives the decision-maker a chance to put a strong grasp over the available information to formulate a more accurate decision. This grasp is obtained by thoroughly analyzing
a single survey from all relevant sides or by performing a trend analysis across multiple distributions of the same or similar surveys.
The main purpose of publishing a survey is to evaluate the feedback of groups of participants against certain aspects. That is where the powerful, decision-support reports provided in SMS come in handy. SMS provides a wide list of analytical reports that cover survey results from all relevant perspectives.
Another strategic analytical tool is the trend reporting which includes the responses to older distributions of the same survey (This feature is called survey redistribution where the same survey containing the same sections and questions and targeting either the same or a different list of participants) to measure performance and satisfaction trend with time to give a better and more decision-support oriented overview on the survey result. This tool could be rather helpful when adhering new techniques or establishing processes that require increasing support over time.
One of the most important business needs for the Survey Management System (SMS) is the overall evaluation of an educational institute of the program. There is an increasing demand from universities and educational institutes represented in deans and management boards to obtain SMS to empower their decision support capabilities and increase their hopes in passing accreditation evaluations offered through various reputable entities.
A well-known accreditation entity that enforces the usage of SMS-like systems is the NCAAA (National Commission for Academic Accreditation and Assessment – KSA) which targets an end-to-end quality assurance process to guarantee the proficiency and efficiency of the management. The NCAAA - through various sections of the Accreditation Requirements references - restricts the evaluation to certain surveys that measure the evaluation of success as well as the satisfaction of participants (managers, teaching staff and students) against the performance of the management and the targets and impacts of their decisions and strategies.